|
|||||||||||||||
|
|
|||||||||||||||
 |
|
|
|
|
|
||||||||||


Background
One
of the most important uses of assessment is to discover a person's
level of achievement at a given point in time, for example, at
the beginning of a course, training programme or new job. It is
also of use by the unemployed job seeker who wishes to find out
her/his achievements, strengths and weaknesses. This is diagnostic
assessment. Until fairly recently, this assessment consisted of
a variety of questionnaires and short answer questions. Now, it
is more likely to consist of a computer-generated programme with
an in-built analysis and evaluation program.
The two examples that follow illustrate the two approaches. They have been developed in the UK for use with students/trainees and job seekers as they try to discover their achievement in the six key skills of Communication, Application of Number, IT, Working With Others, Problem Solving and Improving Own Learning and Performance. The examples are based upon Application of Number and are incomplete; they merely illustrate the principles upon which each is based.
The tests target the individual student or trainee and require simple, straightforward responses that are capable of rapid 'marking' and evaluation. Each test should be introduced by an explanation of what has to be done, and why it is being done.
EXAMPLE A: STUDENT TASK: APPLICATION OF NUMBER
EXAMPLE OF PRINTED ASSESSMENT AND PENCIL-AND-PAPER RESPONSE
 Your teacher will have introduced you to 'Key Skills' earlier
in the lesson and explained what you have to do for this exercise.
This task will help to show your teacher the support you might
need to be given as you work on your Key Skills.
This is not an examination and you will not have to tell your
answers to anyone except your teacher, unless you want to talk
afterwards with your friends and share ideas!
Draw a circle around the number that best describes how confident
you feel at the moment about using the following skills. The list
below describes what each number means.
| 4 = totally
confident? 3 = quite confident? 2 = in need of some guidance? 1 = in need of a lot of guidance? 0 = You do not/have not used this skill. |
Ask yourself this question. How do I feel about using these skills?
In planning an activity and interpreting information, I ...
... plan a substantial and complex activity by breaking it down into a series of tasks.
|
0 |
1 |
2
|
3
|
4
|
... obtain relevant information from different sources, including
a large data set (over 50 items), and use this to meet the purpose
of my activity.
|
0 |
1 |
2
|
3
|
4
|
... use estimation to help me plan, multiplying and dividing
numbers of any size rounded to one significant figure.
|
0 |
1 |
2
|
3
|
4
|
...
make accurate and reliable observations over time and use suitable
equipment to measure in a variety of appropriate units.
|
0 |
1 |
2
|
3
|
4
|
... read and understand scale drawings, graphs, complex tables
and charts.
|
0 |
1 |
2
|
3
|
4
|
... read and understand ways of writing very large and very small
numbers. 0 1 2 3 4
|
0 |
1 |
2
|
3
|
4
|
... understand and use compound measures.
|
0 |
1 |
2
|
3
|
4
|
... choose and justify appropriate methods for obtaining the
results I need.
|
0 |
1 |
2
|
3
|
4
|
The results of the assessment are then analysed through manual scoring and then fed back to trainee and trainer.
EXAMPLE
OF COMPUTER-GENERATED ASSESSMENT, EVALUATION AND FEEDBACK
An alternative version of this diagnostic test uses computer -generated
questions, with the student or trainee 'clicking-on' to the relevant
response,
|
Ask yourself this question. How do I feel about using these skills? In planning an activity and interpreting information, I ... ...
plan a substantial and complex activity by breaking it down
into a series of tasks.
...
obtain relevant information from different sources, including
a large data set (over 50 items), and use this to meet the
purpose of my activity.
(The student/trainee 'clicks-on' to one of the five 'o' with each question.) |
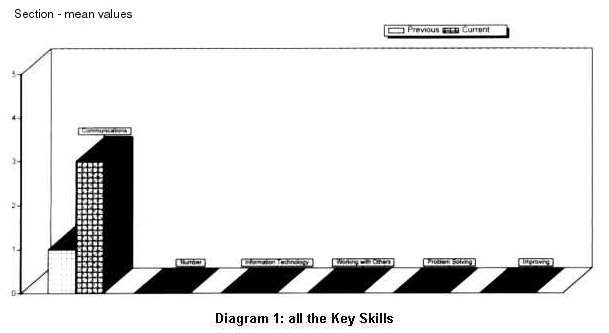
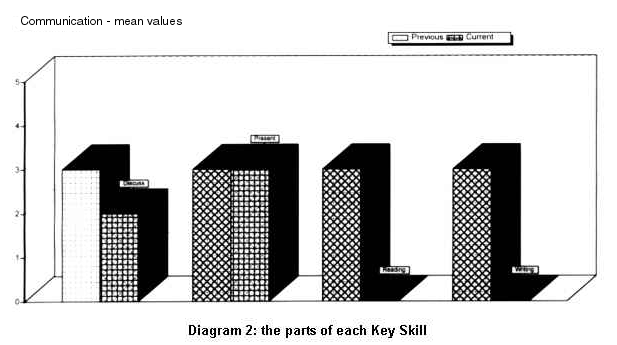
In this example, the responses are analysed by the computer and presented in computer-generated form. The advantage of the computer-generated programme is that the trainee is able to access the tests, the results and the analysis herself/himself. In a later example, data are presented for a trainee's responses in Communication. The first diagram shows the basic grid for all key skills; however, for this example, only the trainee's achievement in Communication is shown. The numbers on the vertical axis refer to the key skills levels of achievement, 1-5, with level 1 the lowest. The second diagram shows how the components of each key skill can be accessed. A further advantage of this approach is that the student/trainee is able to see how s/he has progressed over a period of time, for example, a course or after a training session.
EXAMPLE
B: STUDENT TASK: APPLICATION OF NUMBER - TIME GRAPHS.
FROM
A DIAGNOSTIC ASSESSMENT PROGRAMME IN GREECE
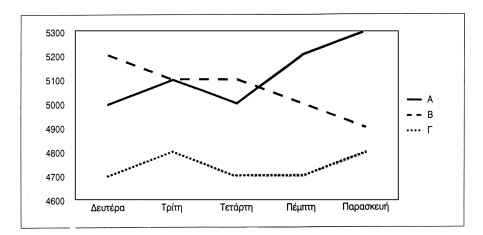
Note: In this example, the test is designed to assess specific aspects of Application of Number, e.g. reading a graph.
Study the graph below.


|
WJEC NREC |
||
| Produced
by: UK: WJEC, NREC Germany: BILSE (Institute for Education and Research), Economic Development Company Greece: PRISMA Sweden: Swedish University Agricultural Department, Hogsby Municipality, Sweden |
||
 |
Project carried out with the support of the European Community within the framework of the Leonardo da Vinci Programme. This document does not necessarily represent the Commission's official position. |
|